Zabbix
Zabbix是一款企业级的分布式监控服务软件。
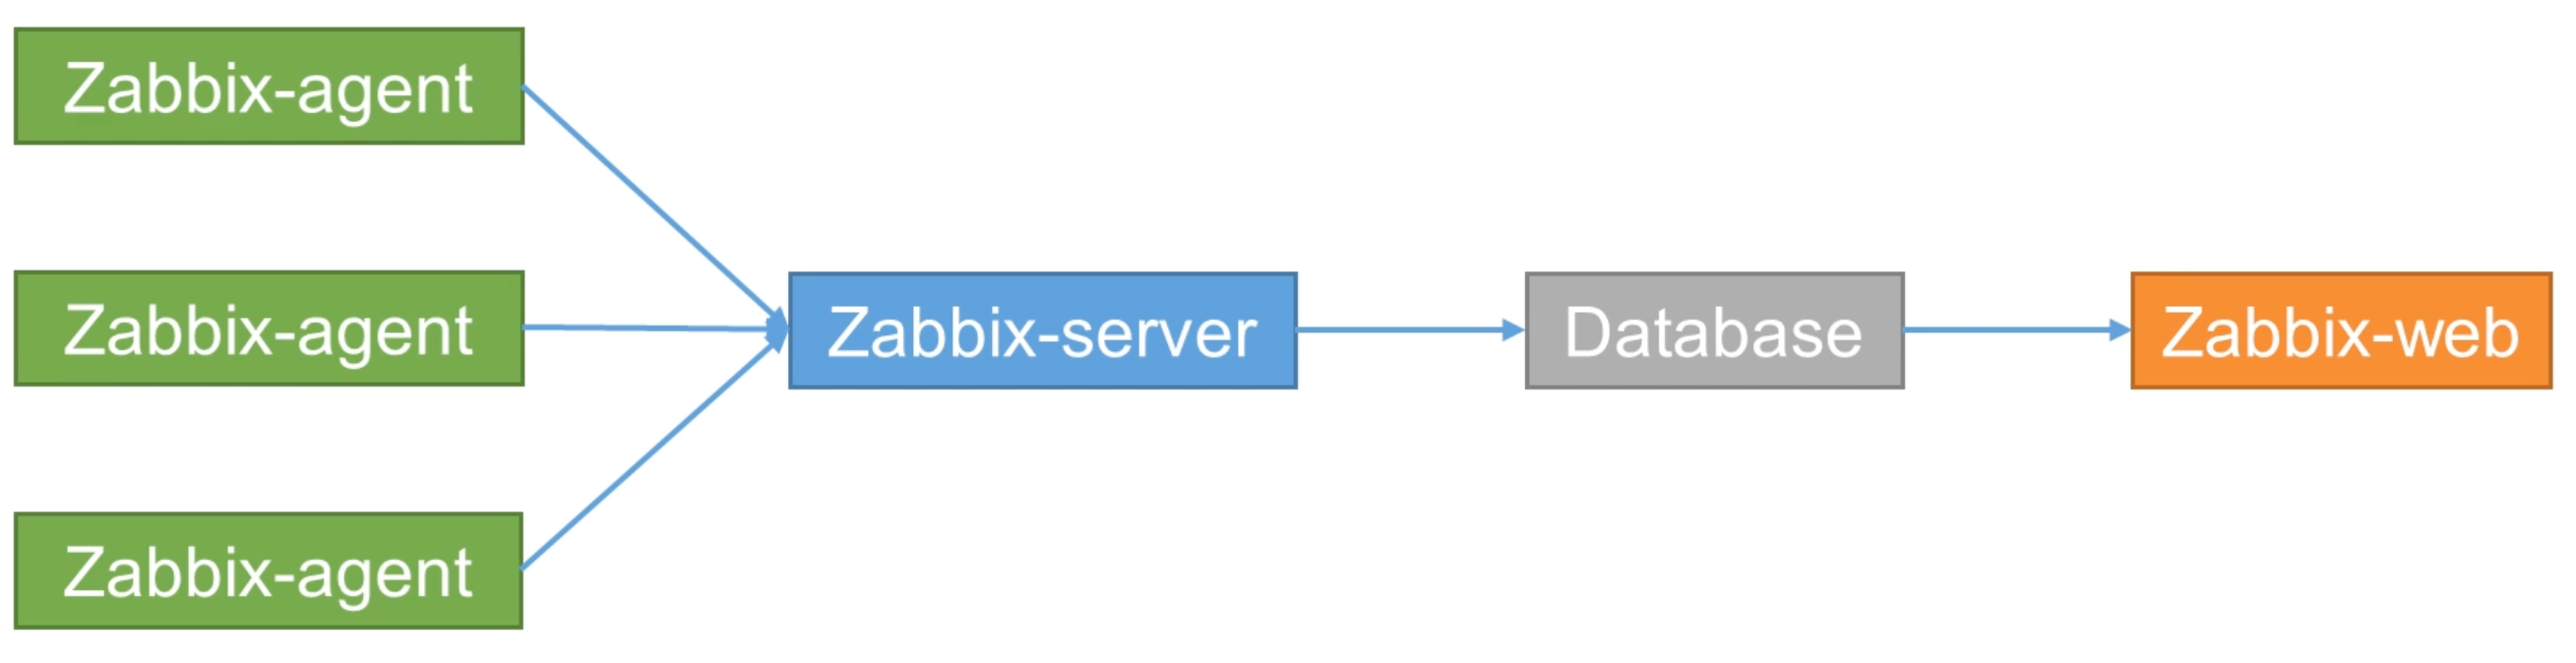
- Zabbix-agent 部署在监控的目标上,主动监控本地的资源和应用。
- Zabbix-server 收集 agent 监控的数据,计算是否满足触发器条件,向用户发送通知
- Database 存储所有的配置信息
- Zabbix-web 监控信息展示
1. 安装 zabbix
1.1 Ubuntu 安装 zabbix 系列包
添加 zabbix 仓库
| wget https://repo.zabbix.com/zabbix/7.0/ubuntu/pool/main/z/zabbix-release/zabbix-release_latest_7.0+ubuntu22.04_all.deb
sudo dpkg -i zabbix-release_latest_7.0+ubuntu22.04_all.deb
sudo apt update
|
| sudo apt install zabbix-server-mysql zabbix-frontend-php zabbix-nginx-conf zabbix-sql-scripts zabbix-agent zabbix-get
|
| sudo apt install mysql-server
sudo systemctl enable mysql --now
|
| #连接数据库
mysql -uroot -p
# 创建 zabbix db
create database zabbix character set utf8mb4 collate utf8mb4_bin;
create user zabbix@localhost identified by 'mo';
grant all privileges on zabbix.* to zabbix@localhost;
set global log_bin_trust_function_creators = 1;
|
| zcat /usr/share/zabbix-sql-scripts/mysql/server.sql.gz | mysql --default-character-set=utf8mb4 -uzabbix -p zabbix
set global log_bin_trust_function_creators = 0;
|
sudo vim /etc/zabbix/nginx.conf
| # 修改如下两行
listen 8080;
server_name example.com;
|
| systemctl enable zabbix-server zabbix-agent nginx php8.1-fpm --now
|
1.2 Ubuntu 只安装 agent
添加 zabbix 仓库
| wget https://repo.zabbix.com/zabbix/7.0/ubuntu/pool/main/z/zabbix-release/zabbix-release_latest_7.0+ubuntu22.04_all.deb
sudo dpkg -i zabbix-release_latest_7.0+ubuntu22.04_all.deb
sudo apt update
|
| sudo apt install zabbix-agent -y
|
| systemctl enable zabbix-agent --now
|
| # 控制集群修改配置
ansible node1,node2 -m shell -a "sudo sed -E -i 's|Server=127.0.0.1|Server=master|; s|^ServerActive=(.*)|#ServerActive=\1|; s|^Hostname=(.*)|#Hostname=\1|' /etc/zabbix/zabbix_agentd.conf" --become -K
# 要修改的配置
Server=master # zabbix的 server 端ip
#ServerActive=127.0.0.1
#Hostname=your_hostname
|
安装 Grafana
1. 使用 helm 安装 grafana
1.1 添加 Helm 仓库
| helm repo add grafana https://grafana.github.io/helm-charts
helm repo update
|
1.2 创建 grafana 文件夹
| md ~/helmProjects/devops/grafana
|
1.3 自定义 grafana
vim ~/helmProjects/devops/grafana/values.yaml
| # 配置管理员账号和密码
adminUser: "admin"
adminPassword: "mo"
# Grafana Service 配置
service:
type: NodePort # 你也可以使用 LoadBalancer 或 ClusterIP
nodePort: 30000
port: 80
# 持久化存储 (可选)
persistence:
enabled: true
storageClassName: grafana-storage
size: 5Gi
# 预配置数据源 (Zabbix)
datasources:
datasources.yaml:
apiVersion: 1
datasources:
- name: Zabbix
type: grafana-zabbix-datasource
access: proxy
url: http://192.168.1.180:8080/api_jsonrpc.php # Zabbix API 地址
jsonData:
username: "Admin" # 你的 Zabbix 用户名
password: "zabbix" # 你的 Zabbix 密码
trends: true
cacheTTL: "5m"
timeout: 30
|
1.4 配置存储
配置 storage-class.yaml
| apiVersion: storage.k8s.io/v1
kind: StorageClass
metadata:
name: grafana-storage
provisioner: kubernetes.io/no-provisioner
volumeBindingMode: WaitForFirstConsumer
|
kubectl apply -f storage-class.yaml
配置 pvc.yaml
| apiVersion: v1
kind: PersistentVolume
metadata:
name: grafana-pv
labels:
app: grafana
spec:
capacity:
storage: 5Gi # 根据需要调整存储大小
accessModes:
- ReadWriteOnce
persistentVolumeReclaimPolicy: Delete # 或 Retain,根据你需求
storageClassName: grafana-storage
hostPath:
path: /storage/zabbix-grafana # 此路径在宿主机上必须存在
|
kubectl apply -f pvc.yaml
1.5 部署
| # 部署 grafana
helm install zabbix-grafana grafana/grafana -f values.yaml
#检查部署状态
kubectl get pods -n default
# 查看 grafana 密码
kubectl get secret --namespace default zabbix-grafana -o jsonpath="{.data.admin-password}" | base64 --decode ; echo
|
1.6 安装 zabbix 插件
zabbix 插件需要自己去 zabbix插件库 下载。
| # 容器内执行
grafana cli plugins install alexanderzobnin-zabbix-app
# 删除 pod ,让k8s重启个新的
kubectl delete pod zabbix-grafana-XXX
|
3. 自定义监控项
自定义的监控项都需要写在 /etc/zabbix/zabbix_agentd.d 目录下。
监控项格式为:
UserParameter=监控项名.[].[], 脚本解释器 脚本位置 $1 $2 ...
/etc/zabbix/zabbix_agentd.d/items.conf
| # 有参监控项
UserParameter=app.status.[*].[*], /bin/bash /etc/zabbix/zabbix_agentd.d/app.status.sh $1 $2
# 无参监控项
UserParameter=system.tem, /bin/bash /etc/zabbix/zabbix_agentd.d/system.tem.sh
|
/etc/zabbix/zabbix_agentd.d/system.tem.sh
| #!/bin/bash
# 输出cpu温度
cat /sys/class/hwmon/hwmon0/temp1_input
|
/etc/zabbix/zabbix_agentd.d/app.status.sh
| # 累计查询的应用进程数量
pgrep -x $1 |wc -l
|
设置完后要重启 zabbix-agent sudo systemctl restart zabbix-agent.service 。
测试监控项运行是否成功 zabbix_get -s 当前主机地址 -k app.status.[nginx].[1]。
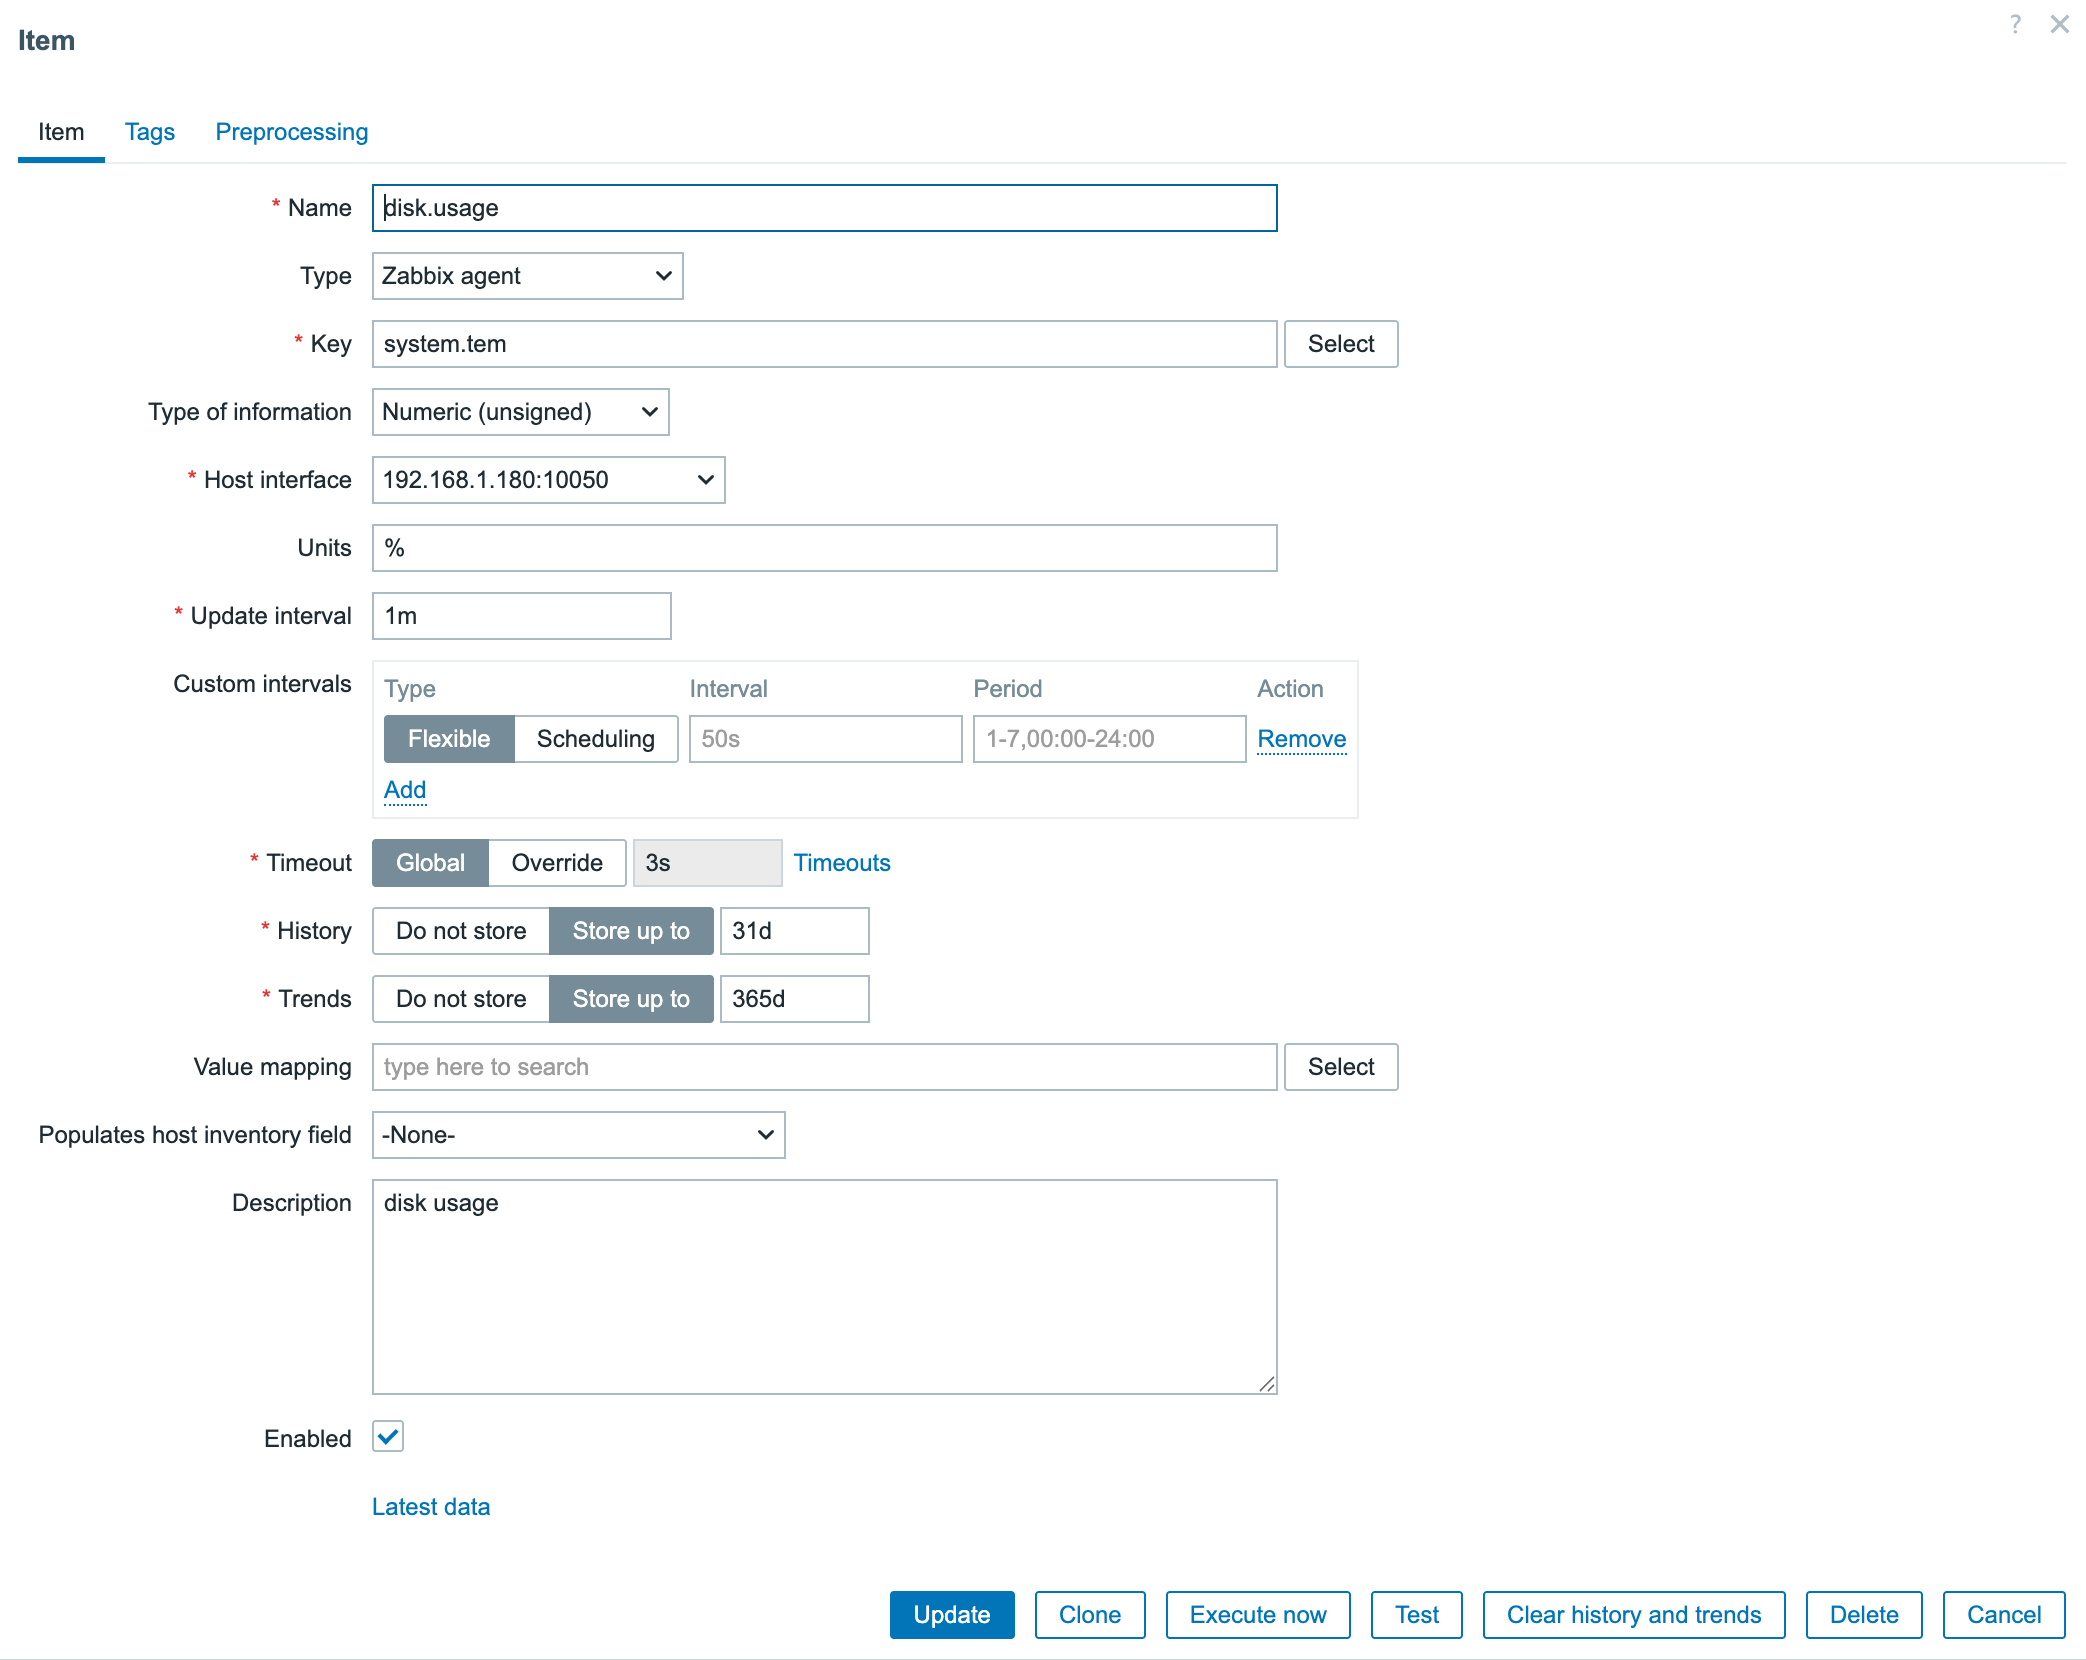
3.2 在 zabbix 中添加监控项
打开 zabbix 网页 -> Data collection -> hosts -> 选择刚才主机的 Items -> 右上角 Create item